Critical infrastructure. Monitored from space.
Omniterra Pulse turns satellite ground movement data into clear inspection priorities, with the evidence behind every finding.
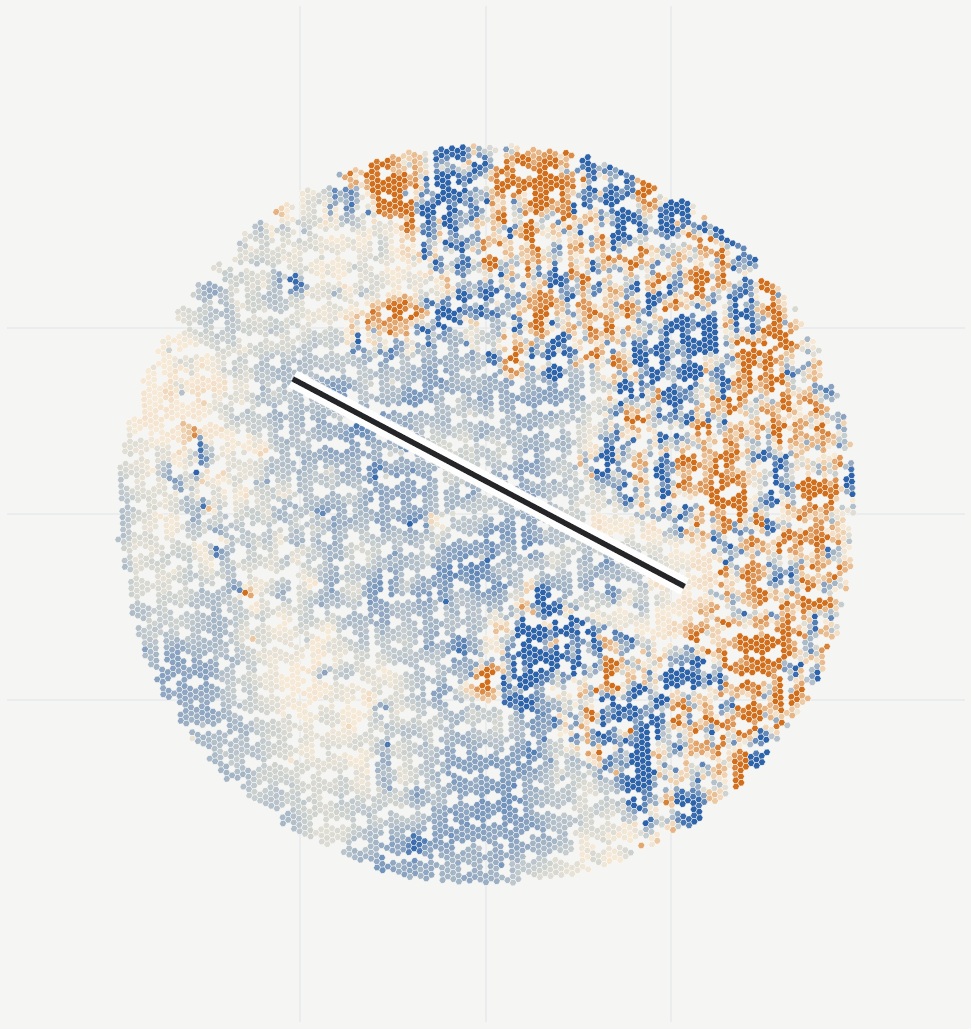
What you receive
Your inspection shortlist. With the evidence.
Use satellite radar (InSAR) to establish a historical movement baseline and follow new observations. Review locations for inspection alongside the history and evidence behind each finding.
We run the monitoring and tailor the asset groups, review criteria and reporting to your team. Start with one site or a portfolio, then revisit priorities as new observations and field findings arrive.
- Inspection priorities
- See which areas were flagged, why they need a closer look and the suggested follow-up.
- Asset movement histories
- Compare years of movement around buildings, tanks and route sections, with the latest observation date in view.
- Dashboard and reports
- Review maps, time series and supporting evidence with your team. Keep recurring summaries and previous report versions.
- Measurements you can reuse
- Export asset tables and GIS layers, with source observations and quality information attached.
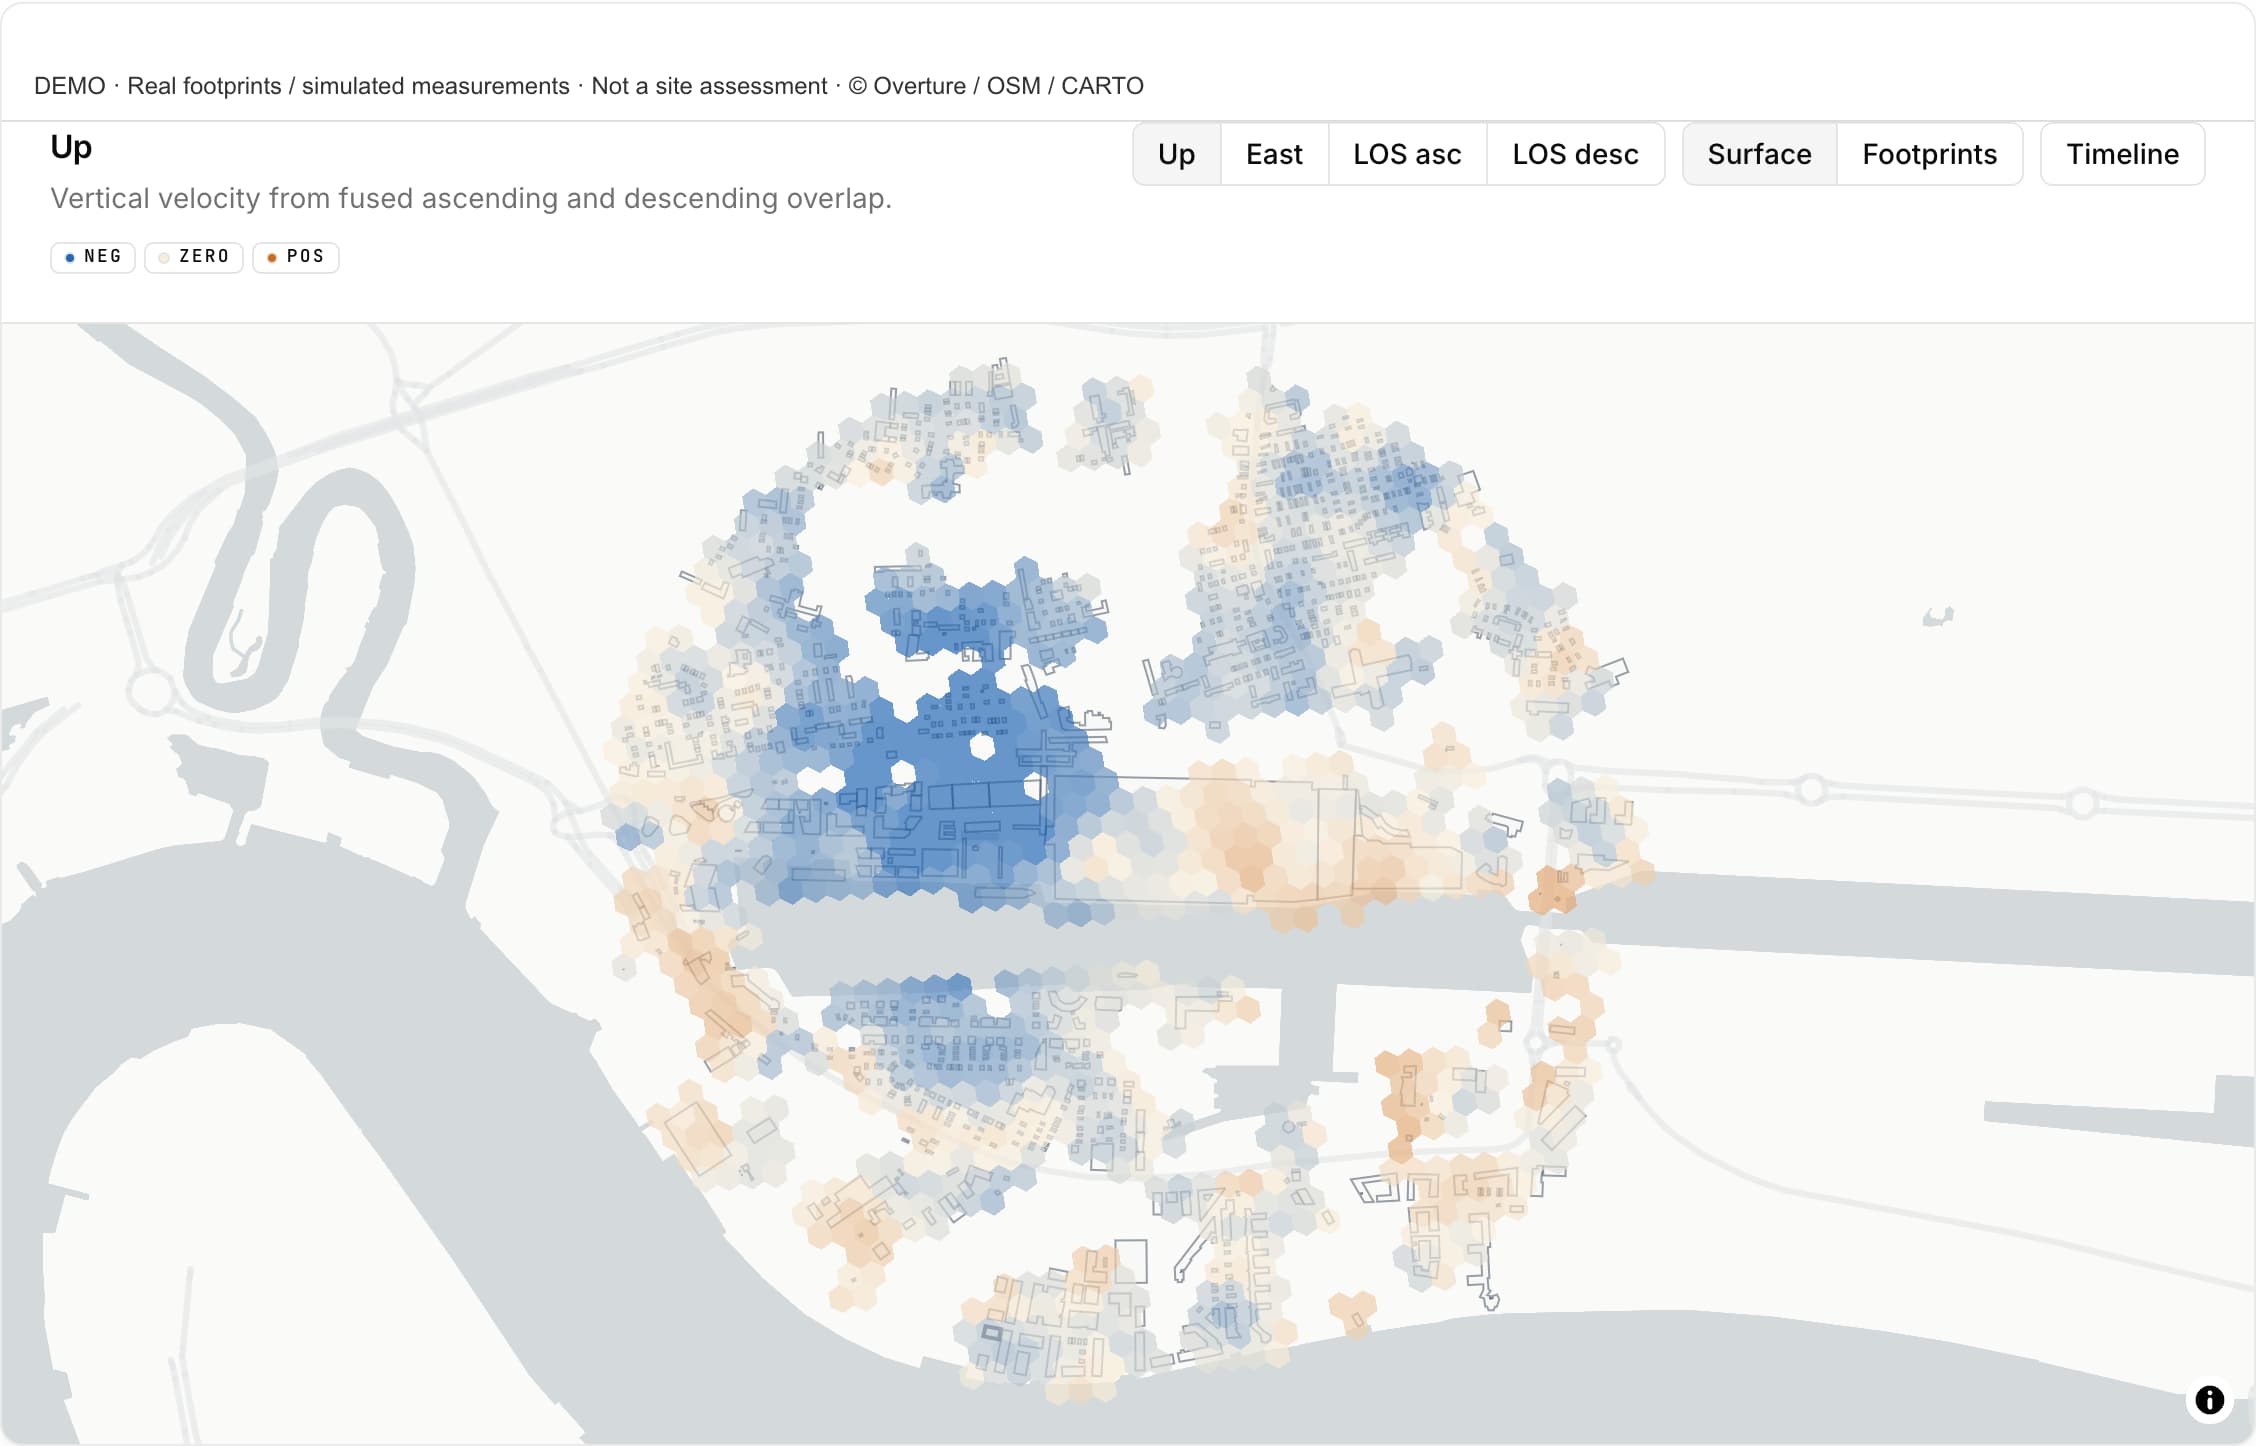
Applications
Inspection priorities across sites and routes.
Monitoring partners
Review years of ground movement before choosing where to place instruments or send survey crews. Add a site-wide baseline to your monitoring proposal, with maps, asset histories and reports delivered under your brand.
Railways and pipelines
Review movement along supported route sections before planning field access. Compare segment histories, nearby ground and coverage gaps to focus drainage checks, surveys and geotechnical investigations on locations that deserve a closer look.
Ports and terminals
Compare movement across quays, yards, tanks and reclaimed ground before the next civil survey. Group the findings by operating area to help plan maintenance checks and make better use of limited site access.
Data centres and major facilities
Review ground movement around buildings, service yards and utility routes before the next investigation. Compare the longer history with recent observations to focus ground, drainage and access checks around your critical facilities.
Capabilities
InSAR ground motion monitoring, built around your assets.
Explore how movement varies over time, across an asset and against nearby ground. Inspect the observations behind an apparent change, with coverage and measurement quality in view.
Review surface changes, weather and seasonal patterns alongside ground motion. These comparisons support investigation; they do not establish the cause of movement. Available analyses depend on observation history and coverage.
Measurement
- Radar movement histories
- Compare ascending and descending line-of-sight measurements independently, with explicit relative or GNSS reference frames.
- East + Up decomposition
- Estimate east–west and vertical motion where both viewing directions support it. This calculation does not resolve north–south motion.
- Atmospheric correction comparisons
- Compare corrected and uncorrected results to inspect the effect of atmospheric treatment.
Movement over time
- History and acceleration
- Use the Sentinel-1 archive and new acquisitions to compare long-term rates, recent acceleration and turning points.
- Persistent change and recovery
- Where the history supports it, review changes that persisted or recovered. Observation dates bracket when a change occurred; retrospective patterns are not forecasts.
- Dated maps and reproducible runs
- Replay displacement across epochs and bands. Keep sensing dates, source identifiers and the processing version needed to reproduce each result.
Measurement quality
- Temporal coherence and coverage
- Inspect signal stability, observation density, confidence, exclusions and processing status. Gaps remain visible.
- Independent comparison
- Compare with external reference products such as EGMS where coverage and reference conditions allow it.
Asset movement
- Named assets and 3D history
- Review movement histories around your parcels, buildings, pads and operating areas. Inspect local observations and coverage, with 3D context where available.
- Asset and nearby-ground comparisons
- Compare asset observations, nearby ground and their difference on supported dates. See whether a movement pattern is shared with the surroundings before choosing where to investigate.
- Spatial differences across an asset
- Inspect how observed movement varies across an asset footprint. Review the measurements behind patterns that an overall average can hide.
- Corridor profiles
- Follow movement along supported railway and pipeline sections by distance along the route. Compare segment histories with coverage gaps kept visible.
- Reports and open files
- Receive PDF reports, browser review, COG rasters, epoch-indexed H3/Arrow histories and asset tables in GeoJSON, GeoParquet or Parquet.
Site and environmental context
- Terrain and Sentinel-2 context
- Review elevation, slope, land cover, vegetation, clearing, bare soil and water along sites, railways and pipelines. Optical change stays separate from radar displacement.
- Seasonal response modelling
- Explore associations between movement, rainfall, temperature and soil moisture where sufficient observations are available. This retrospective analysis does not establish cause or predict future movement.
- Additional sensors and coverage
- Scope NISAR, commercial SAR, multi-track analysis or wider corridors where the location and measurement needs justify them.
Monitoring and integration
- Updates and field checks
- Receive summaries and notifications on the agreed schedule. Add inspection findings and completed work, then review subsequent movement. Each report shows the latest usable observation date.
- Traceability and AI access
- Keep findings linked to sources, methods and previous report versions. API and MCP access is available for your engineering software and AI tools, with agreed permissions.
Measurement quality and interpretation
- Each map exposes its reference frame, acquisition history, temporal coherence, and observation density.
- Movement patterns can be compared with terrain, water, weather, and field data while each source remains a distinct layer.
- Sparse or low-coherence areas remain mapped as coverage gaps so teams can target additional observations or field checks.
- Movement flags support engineering review and inspection planning. They are not a structural safety assessment or emergency-warning service.
Questions
Before monitoring starts.
What to expect from the measurements, reporting and service.
- What does InSAR ground monitoring measure?
- InSAR compares repeated satellite radar observations to measure displacement in the satellite viewing direction. Pulse connects those measurements to your sites and routes, with movement histories, reference frames and coverage information for engineering review.
- Can we compare an asset with the surrounding ground?
- Where observations support it, Pulse shows asset movement, nearby-ground movement and their difference. Spatial comparisons help you inspect local patterns; they do not by themselves establish structural damage or its cause.
- What coverage and updates can we expect?
- We check radar visibility and surface conditions first. We agree the reporting schedule, including weekly summaries where scoped. A report may contain no new measurements. Each site shows its latest usable observation date, measurement quality and coverage gaps.
- Does a flag mean an asset is unsafe?
- No. It identifies movement for engineering review and helps target inspection. It is not a safety assessment or an emergency-warning service.
- Can weather and seasonal patterns explain movement?
- Pulse can compare movement with past temperature, rainfall and moisture where enough history is available. Environmental response modelling is retrospective and exploratory: an association does not establish the cause or predict future movement.
- Can our engineers reuse the evidence?
- Review the dashboard and PDF reports, or export asset tables and GIS layers with dates, source references and quality information. API and MCP access is available for engineering tools. We agree the required formats, access and retention as part of the scope.
- What do we agree before monitoring starts?
- The sites and corridor lengths, baseline period, reporting schedule, review process and monthly fee. We also agree data access, retention, exports and any integration work. Your team does not need an integration to use the reports and dashboard. We can also scope a one-off study.
Start with your site list.
Start with one site or a portfolio. We will check coverage and propose a scope before monitoring starts.
Send your locations
Share site names, map links or boundaries. Tell us which assets and decisions matter. You do not need to prepare GIS files.
Agree the service
We check coverage and agree the historical baseline, monitored areas, reporting schedule, review criteria and monthly fee. Any additional work is agreed separately.
Review and follow up
We deliver the reports and measurements. Add inspection findings and completed work to the site record, then follow subsequent movement.